Revolutionary
Server Monitoring
Connect directly to your server management panels - iDRAC, iLO, IPMI, and more. Get real-time hardware metrics, intelligent alerting, and comprehensive monitoring without agents.
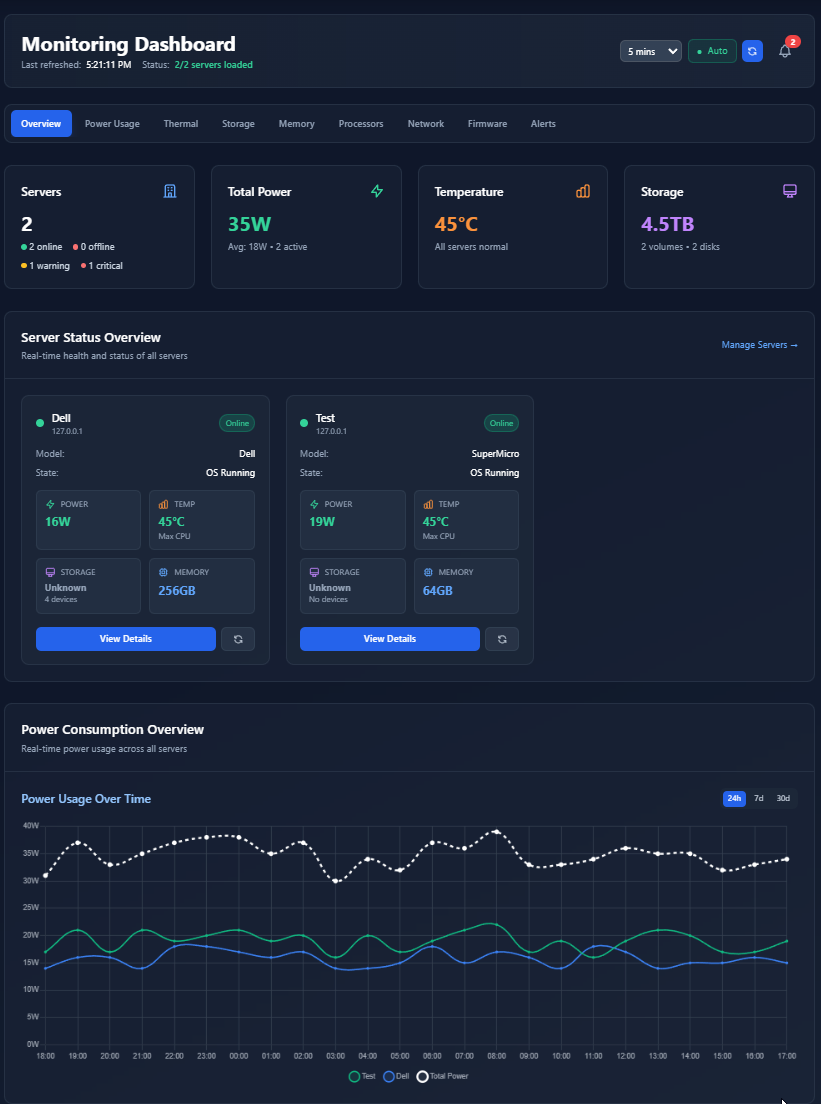
ThunderPanel Dashboard Preview
Image: /monitoring-dasboard.png
See ThunderPanel in Action
Explore our comprehensive monitoring platform with real-time dashboards, professional status pages, and detailed uptime analytics.
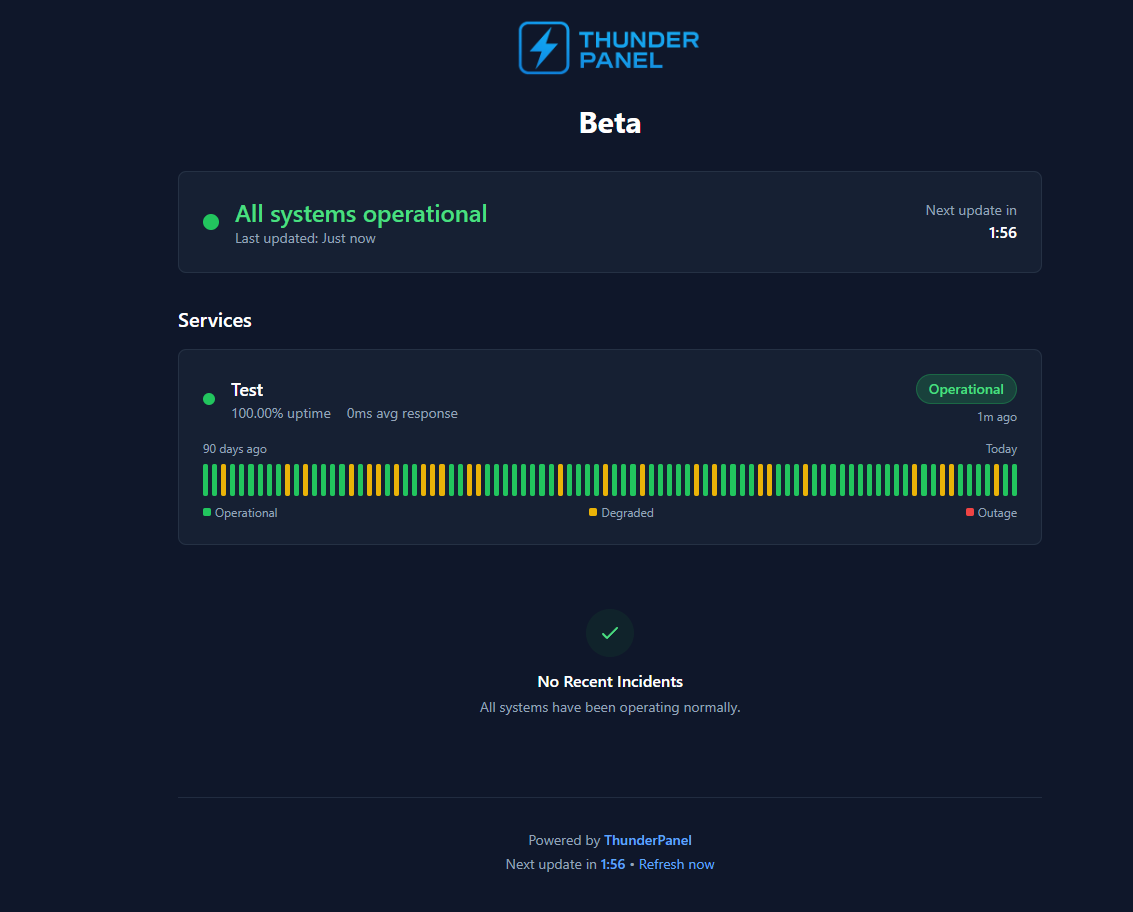
Professional Status Pages
Keep your customers informed with beautiful, branded status pages
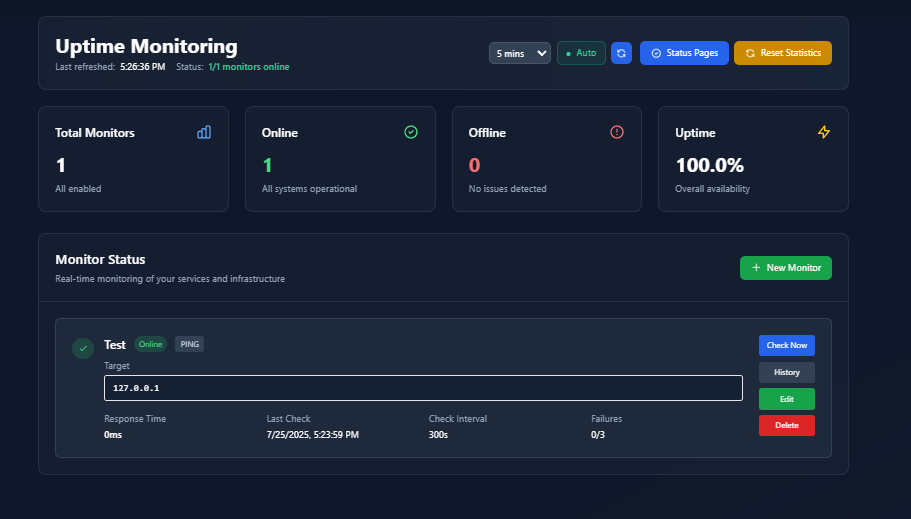
Detailed Uptime Analytics
Track performance trends and identify patterns with comprehensive reporting
Universal Management Panel Integration
Connect to any server management interface. Our platform automatically detects and configures monitoring for your existing management panels.
Direct API Access
Connect directly to your server's management interface using standard protocols like Redfish, IPMI, and vendor-specific APIs.
Auto-Discovery
Automatically discover and configure monitoring for servers on your network. No manual setup required for supported management interfaces.
Enterprise Security
Secure connections with encryption, certificate validation, and role-based access control. Enterprise-grade security for your infrastructure.
Smart Alerts with Discord Integration
Get rich, contextual alerts directly in Discord with server metrics, graphs, and one-click incident management. The future of infrastructure communication.
Why Choose ThunderPanel?
See how we compare to traditional monitoring solutions and other server monitoring platforms.
| Feature | ThunderPanel | Traditional SNMP | Agent-based Tools |
|---|---|---|---|
| Direct Hardware Access | |||
| Power Monitoring | Limited | Basic | |
| No Agent Required | |||
| Discord Integration | |||
| Auto-Discovery | Manual | Manual |
Monitor Everything That Matters
Get comprehensive visibility into your server infrastructure through direct management panel integration.
Real-time Power Monitoring
Track power consumption, efficiency ratings, and PSU health directly from your server's management interface. Get alerts before power issues impact operations.
Power Consumption - Last 24h
Temperature Zones
Hardware Health Monitoring
Monitor CPU, memory, chassis temperatures, and component health directly from hardware sensors. Detect issues before they impact performance or cause downtime.
Ready to Revolutionize Your Monitoring?
Join the hosting providers who've eliminated monitoring blind spots with ThunderPanel's direct management panel integration.